Data Visualization

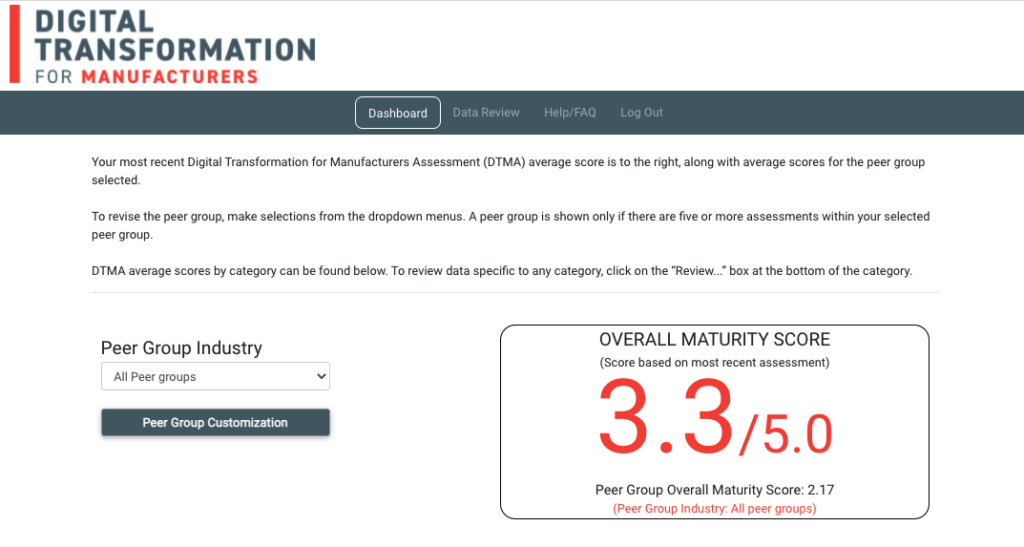
The Digital Transformation for Manufacturers Assessment (DTMA) helps teams determine a level of digital maturity for their company, as well as for each category of functional activities within the company. Immediately after submitting an assessment, a team is taken to an online site that displays their digital assessment.

Teams log into the data visualization site with the same email and passcode they used when completing an assessment. Teams are then taken to the Dashboard and shown their overall average score or their assessment — from 0 to 5 — compared to the maximum possible score (5) and to the average score for a peer group of companies.

To review your assessment results when NOT being redirected from a new assessment, go to: DTM Data Visualization

Dashboard — Overall Score

Beneath the overall score are the scores for each of the business categories represented:


  • Business
  • Production
  • Warehouses/Distribution Centers
  • Supply Chain
  • Logistics/Transportation
  • Customers
  • Support Functions
  • Smart Products


The score for a manufacturer’s most recent assessment appears in bar charts (below the average score of a peer group for the category). If previous assessments have been completed, the three most recent assessments will appear. Dates for the assessments are identified above the category scores, with (1) denoting the most recent assessment. The peer group and current company average scores appear below the bar charts.

Dashboard — Category Scores

The DTMA visualization site also allows teams to revise the peer group, filtering the database of assessments by Industry as well as customized peer group categories:


  • State
  • Ownership structure
  • Annual revenues
  • Number of employees
  • Number of manufacturing facilities
  • Nature of production processes
  • Volume and mix of product
  • Method to manufacture


Once categories are selected for customized peer groups, they  are shown at the top of the page. To maintain the confidentiality of companies submitting assessments, customized peer groups must contain 5 or more assessments.

Customized Peer Groups

Below each category bar chart is a click-through button — e.g., “Review Business Data” — that links to a Data Review page where a team can review their responses to questions by category vs. the peer group. Category-specific comments provided by teams are provided below the category.


Teams can switch to different categories the Data Review page or revise peer groups as they wish.

Data Review

The DTMA also contains a Help/FAQ page and the ability to print or save a page as PDF